What 27 years as a marketing operator, three private-equity-backed companies and decades of financial history tell us about competitive advantage, business maturity and the economics of sustainable growth.
The writing on the wall
Getty Images announced on October 12, 2026, that it had reached an agreement with its major financial stakeholders to restructure through a prepackaged Chapter 11 process, with the expectation of returning to private ownership. The proposed transaction includes an equity commitment of approximately $533 million from its principal shareholders, including the Getty family and Koch Equity Development, along with changes to its debt structure intended to improve its financial position. Getty expects to continue operating normally throughout the process, and the announcement shouldn’t be confused with a decision to liquidate the business.
Most of us will probably glance at the news and move on. Getty Images, stock photography, generative AI. The writing on the wall seems pretty obvious. After all, why pay for stock imagery when technology can generate seemingly limitless alternatives in seconds? But perhaps that’s precisely why we overlook what these developments mean for our own businesses. The explanation may appear straightforward, but the consequences for an established organization, its relationships, capabilities and operating economics are considerably more complicated.
Getty spent three decades building relationships with major publishers, advertisers, entertainment companies, sporting organizations and content creators. It accumulated extensive archives, exclusive access to certain events and content, commercial licensing capabilities and a distribution network that would be extraordinarily difficult to replicate. More than 70% of its booked revenue in 2025 came from customers with relationships spanning at least ten years. By most conventional measures, these are formidable competitive advantages, particularly when viewed through Michael Porter’s work on competitive strategy.
Yet those advantages don’t necessarily protect the economics of the products and services built around them. A publisher might retain its Getty relationship while reducing purchases of generic imagery. An advertiser may continue licensing exclusive editorial or entertainment photography while replacing other creative requirements with generated content. The relationship survives, but the revenue, pricing and contribution margin associated with it may change substantially. None of this establishes that Getty’s customers have universally reduced spending or that AI alone caused its restructuring. The point is that the economic value of a competitive advantage can change independently of whether the advantage itself still exists.
This raises a question I’ve become increasingly interested in: Can the relationships and capabilities that made a business successful continue to support the organization built around them? It’s a question about considerably more than Getty. It applies to businesses whose products are becoming increasingly substitutable, those whose distribution has shifted to powerful intermediaries, and those whose internal operating models were designed around market conditions that no longer exist.
I wanted to explore this through three businesses that went from private-equity ownership back to public markets: Hilton Worldwide, HCA Healthcare and Party City. Two continued operating successfully as public companies. The third filed for bankruptcy twice and ultimately wound down its corporate retail business. Their histories are very different, but they provide useful evidence of how growth, organizational design, capital requirements and competitive advantage interact over time.
Why I’m building the Growth Quality Score
I’ve spent 27 years in marketing, much of it as a relentless operator. I’ve worked across businesses at very different stages of maturity, with different growth expectations, customer dynamics, competitive pressures and organizational challenges. Over that time, I’ve developed a particular appreciation for the difference between having an idea, building something around it and establishing an operating system capable of producing sustainable results.
Years ago, I remember meeting with the Meatless Monday folks at the Yale Club in New York. During the conversation, one of their leaders described me, quite directly, as the “how” guy. I eventually extrapolated that into describing myself as a “blue-collar marketer.” I never considered it a slight, nor did I spend much time thinking about it. It was a reasonable description of how I approached the work, and in many respects it still is.
The world has no shortage of ideas. I certainly don’t. What I’ve found considerably less common is a clear-eyed understanding of how to execute those ideas, make the economics work and build a durable system that can withstand the challenges a business will inevitably face throughout its lifespan. An interesting concept might create the initial opportunity, and a compelling product or service might generate early demand, but translating that into a business capable of sustaining growth requires an entirely different level of operational discipline.
I’ve also learned that businesses rarely evolve according to plan. We make deliberate decisions about products, pricing, customer acquisition, hiring, capital allocation and organizational design, each intended to produce a particular outcome. Those decisions create dependencies, some anticipated and others not. A promotional strategy might increase new customers while reducing the quality of the cohorts acquired. A new sales channel might improve distribution while gradually transferring the customer relationship to an intermediary. An organizational structure that worked brilliantly at $50 million in revenue may introduce unnecessary complexity at $500 million.
Meanwhile, the environment continues changing. Competitors introduce alternatives, suppliers renegotiate terms, customers change how they discover and evaluate products, and technological innovation changes what can be delivered and at what cost. Some of those developments are incremental. Others can undermine years of investment almost overnight. An organization may still be executing against its original plan when the market has already moved beyond the assumptions supporting that plan.
This is what led me to think about developing a more structured way to analyze the maturity of a business, the quality of its growth and its exposure to the environment in which it operates. I’d like to better understand the interaction between internal decisions, both planned and unplanned, external developments, and an organization’s response to those changes. Throughout that exercise, the customer, relationships and competition remain central because they ultimately determine demand, value creation and the economics a business can retain.
I don’t particularly want another framework that looks impressive in a presentation and does little to improve the business. I’m interested in whether we can develop something practical that helps us understand what’s working, what isn’t, why the economics are changing and how leadership can intervene before the consequences become difficult to reverse.
The Doomsday Score and the Growth Quality Score
I’ve started thinking about two related measures. The first, which I’m calling the Doomsday Score, evaluates the vulnerability of a category’s competitive advantages to changes in technology, competition, customer behavior and market economics. The second, the Growth Quality Score, or GQS, examines how effectively a business converts its market position, customer relationships and operating capabilities into sustainable economic value.
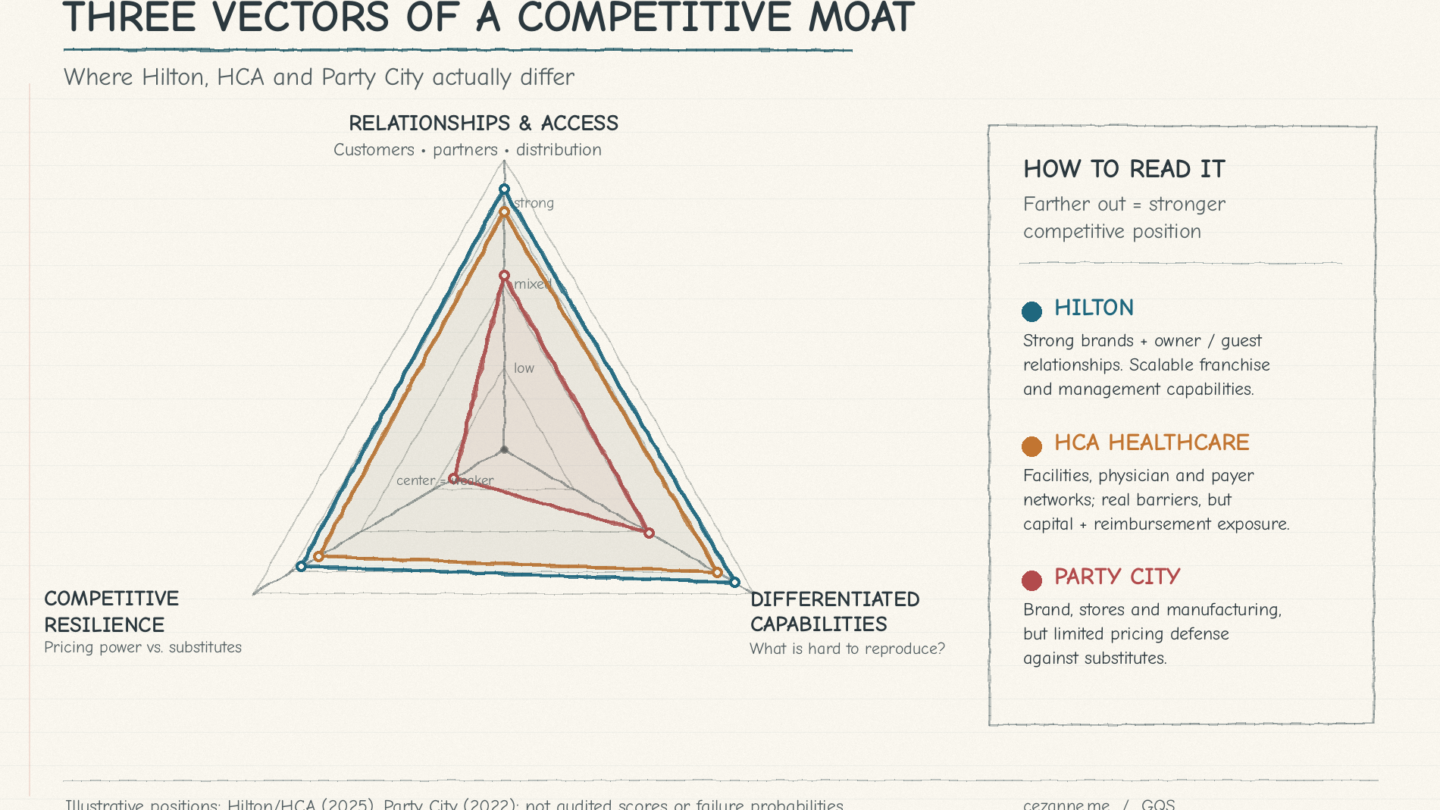
For the Doomsday Score, I’d begin with three interconnected vectors: relationships and market access, differentiated capabilities, and the competitive pressures that influence pricing power and substitutability. Porter’s Five Forces provide a useful foundation for the third vector, especially when examining the bargaining power of buyers and suppliers, threats from new entrants and substitutes, and the intensity of existing competition. I’d also want to understand how rapidly those pressures are changing, because their rate of change can be as consequential as their current severity.
The Growth Quality Score brings that assessment inside the business. A category could be experiencing substantial disruption while an individual company remains capable of adapting and generating attractive returns. Conversely, an industry might appear relatively stable while a business within it experiences deteriorating customer economics, excessive capital requirements or an operating structure that becomes progressively more expensive to maintain.
I’d propose six components for the GQS, with a combined weighting of 100 points.
| Dimension | Weight | What I’d examine |
|---|---|---|
| Customer demand and durability | 20 | Acquisition quality, retention, repeat behavior, organic demand, customer value and concentration |
| Pricing power and differentiation | 15 | Realized pricing, discount dependency, competitive alternatives and willingness to pay |
| Incremental contribution economics | 20 | Fully loaded acquisition cost, marginal contribution, payback and returns from new business |
| Cash conversion and capital requirements | 20 | Operating cash, working capital, maintenance and growth investment |
| Financial resilience | 15 | Debt, interest obligations, liquidity, financing capacity and downside exposure |
| Operating-model adaptability | 10 | Organizational maturity, decision quality, experimentation and the ability to respond to change |
The weights are an initial hypothesis rather than a statistically validated model. They would need to be calibrated by industry and tested against historical outcomes before being used to predict business distress. I also wouldn’t assume that the same measure means the same thing across different business models. Customer LTV and acquisition payback are highly relevant to subscription businesses, while hotel franchising, hospital operations and physical retailing require different definitions of the economic unit.
I would measure each dimension using a combination of current performance, historical trends and forward-looking indicators. Importantly, the score needs to account for the quality of the underlying data. A business with incomplete customer economics or inconsistent financial definitions shouldn’t receive a high-confidence assessment simply because its reported numbers look attractive.
And the score needs to connect to decisions. An organization that identifies weakening pricing power but continues allocating resources as though nothing has changed isn’t improving its position by measuring the problem. The value comes from understanding the consequences, testing alternatives and making changes that improve the underlying economics.
With that in mind, I wanted to examine three businesses whose financial histories provide unusually useful evidence of what happens when capabilities, capital and execution interact over time.
Hilton Worldwide: Making the operating model more valuable than the physical assets
In July 2007, Blackstone agreed to acquire Hilton Hotels Corporation in a transaction valued at approximately $26 billion, including debt. The acquisition closed on October 24, 2007, with shareholders receiving $47.50 per share. Hilton was already an established global hospitality business, with brands, distribution capabilities, hotel ownership interests, management contracts and a substantial presence across multiple lodging segments.

The timing of the acquisition was hardly ideal. Within a year, the global financial crisis would severely affect credit markets, consumer spending, corporate travel and hotel operating performance. For a business involving substantial hotel property ownership and financing obligations, those were particularly challenging conditions. A transaction that might have looked attractive under more favorable market assumptions faced a very different economic reality shortly after closing.
Blackstone appointed Christopher Nassetta president and CEO in October 2007. Nassetta came from Host Hotels & Resorts, where he had extensive experience with hotel ownership and the economics of lodging assets. His appointment matters because Hilton’s challenge wasn’t simply generating more demand for hotel rooms. It needed to examine the organization, its portfolio of activities and the way its brands and commercial capabilities could generate value across a larger network.
Hilton’s 2013 IPO prospectus described a transformation that included organizational alignment, brand development, operating performance and expansion of its management and franchise business. Those changes weren’t independent workstreams. They affected the economics of how Hilton could grow, where capital needed to be invested and which capabilities would become increasingly important to the organization.
What changed between the buyout and the IPO
Before the transformation, Hilton operated three major business segments: management and franchising, owned and leased hotels, and timeshare. Each benefited from hotel demand and the company’s brands, but the capital required to expand them differed considerably. Owning an additional hotel involves real estate, equipment, renovation, maintenance and financing. Franchising an additional hotel involves a different set of investments in distribution, reservations, brand standards, owner relationships, technology and commercial support.
That distinction became central to Hilton’s growth strategy. Between June 2007 and September 2013, Hilton expanded its open room count by approximately 176,000 rooms, or 36%. Its management and franchise segment grew room count by approximately 40%, accounting for 98% of the company’s overall room growth, with virtually no corporate capital investment in those additions. Hilton’s development pipeline also increased 60% to roughly 185,700 rooms, with more than 99% of those rooms in the management and franchise segment.
The company was expanding its economic reach without needing to finance the same proportion of additional physical infrastructure. Its brands, distribution, reservation capabilities and management expertise could be extended across properties owned by other parties, with Hilton earning management, franchise and licensing fees associated with those relationships.
The geographic component was equally important. Rooms in the development pipeline outside the United States increased from less than 20% to more than 60%, while international rooms under construction increased from less than 15% to nearly 80%. Hilton was expanding into markets where its brands had historically been less represented, using commercial capabilities that could support a larger network without requiring the company to become the principal real estate investor in every market.
Hilton returned to public markets in December 2013 at $20 per share. Blackstone retained substantial ownership following the IPO, so the listing wasn’t the end of the sponsor’s involvement. In fact, the more revealing step came several years later, when Hilton completed the separation of Park Hotels & Resorts and Hilton Grand Vacations in January 2017.
That transaction created three separately traded businesses. Park held substantial hotel real estate, Hilton Grand Vacations operated the timeshare business, and Hilton Worldwide became more concentrated around its management, franchise and commercial services operations. In its 2016 investor presentation, Hilton described a post-separation business expected to generate approximately 90% of adjusted EBITDA from fees.
The transaction changed more than the capital structure. It helped clarify which capabilities Hilton intended to monetize and how the organization would expand. The commercial proposition increasingly centered on brands, distribution, customer relationships, reservation infrastructure and operating expertise, rather than requiring direct ownership of a proportionate share of the hotel network.
What the 2025 numbers tell us
Hilton’s 2025 results demonstrate how far this model has developed. At year-end, the company reported 9,158 properties and 1,351,351 rooms across 143 countries and territories, with approximately 243 million Hilton Honors members. During the year, it opened approximately 97,000 rooms, added a net 81,100 rooms and achieved 6.7% net unit growth. The development pipeline reached approximately 520,500 rooms.
The financial reporting requires careful interpretation because Hilton’s consolidated revenue includes substantial cost reimbursements collected and spent on programs operated for hotel owners. Simply dividing adjusted EBITDA by headline GAAP revenue can therefore obscure the economics of its fee-based operations.
| Hilton metric | 2024 | 2025 |
|---|---|---|
| Franchise and licensing fees | $2.60B | $2.78B |
| Management fees | $659M | $689M |
| GAAP consolidated revenue | $11.17B | $12.04B |
| Cost reimbursement revenue | $6.43B | $7.09B |
| Adjusted EBITDA | $3.43B | $3.73B |
| Operating cash flow | $2.01B | $2.13B |
| Comparable system-wide RevPAR growth | — | 0.4% |
Hilton’s management and franchise segment comprised 873 managed properties and 8,239 franchised or licensed properties at the end of 2025. Its ownership segment contained only 46 hotels, representing 15,287 rooms. That is a very different business mix from the organization Blackstone acquired in 2007.
The distinction between 6.7% net unit growth and 0.4% comparable RevPAR growth is worth examining. Hilton’s existing hotel base wasn’t generating exceptional comparable revenue growth, but the business continued increasing its fee-generating network. The economics of expansion therefore depended substantially on adding properties, retaining hotel owners, maintaining franchise economics and making the Hilton commercial proposition valuable to both owners and guests.
Hilton’s disclosed franchise and licensing revenue increased approximately 6.9% in 2025, while management fees grew approximately 4.6%. That growth came from multiple sources, including network expansion, contractual fees and partnerships. Revenue from co-branded credit cards and other licensing arrangements also contributed, demonstrating that Hilton could monetize its customer relationships and commercial ecosystem beyond the hotel stay itself.
For Growth, there’s an important implication. The customer relationship isn’t simply the hotel guest. Hilton also needs property owners and developers who view its brands, reservations, loyalty program and operating support as economically attractive. If the guest proposition weakens, the owner proposition can eventually weaken with it. If Hilton maintains strong customer demand and distribution, owners have a reason to enter or renew long-term agreements, creating further network expansion opportunities.
This is a system of interconnected economics. Additional properties increase availability and opportunities for customers to stay within Hilton’s portfolio. More guest engagement can improve the attractiveness of the platform to hotel owners. The expanded network can then generate more franchise and management fees, subject to contractual terms and operating performance.
Where I’d challenge Hilton’s growth quality
Hilton’s operating model is attractive, but it shouldn’t be presented as indestructible. The company reported approximately $12.5 billion in debt at the end of 2025, and its 2025 financial statements show that it repurchased approximately $3.2 billion in shares while generating $2.13 billion in operating cash. Buybacks, financing and capital allocation therefore need to be assessed alongside operational growth.
I’d also examine the economics from the hotel owner’s perspective. A franchise fee can be attractive to Hilton while becoming less attractive to an owner facing higher financing costs, labor expenses, renovation requirements or declining property-level profitability. Hilton’s distribution and brand capabilities have value only while they continue producing appropriate returns for both parties.
My GQS assessment would therefore look beyond Hilton’s own revenue and margin. I’d want to understand owner retention, new development economics, franchise fee realization, the customer demand generated by Hilton’s distribution network, loyalty behavior, direct versus intermediary bookings and the cost of maintaining brand standards and commercial infrastructure.
The larger lesson is that Hilton didn’t simply retain valuable relationships and brands. It developed an operating model that allowed those capabilities to support expansion with comparatively limited direct property investment. Its growth system became more scalable because the organization changed how it captured economic value.
HCA Healthcare: Making a capital-intensive business generate the cash to keep growing

HCA Healthcare offers a different lesson because the operating model cannot be made asset-light in the same way. Hospitals require substantial physical infrastructure, clinical equipment, highly trained professionals, regulatory compliance and continuous reinvestment. The business also depends on complicated relationships with physicians, payers, government programs and the communities it serves.
HCA was founded in 1968 by Dr. Thomas Frist Sr., Dr. Thomas Frist Jr. and Jack Massey. By 2006, it had become one of the largest hospital operators in the United States. In July of that year, an investor group led by Bain Capital, Kohlberg Kravis Roberts, Merrill Lynch Global Private Equity and founder Thomas Frist Jr. agreed to acquire the company. The transaction closed in November 2006 at approximately $33 billion, including the assumption or repayment of $11.7 billion in debt.
Jack Bovender was chairman and CEO at the time of the transaction, and Richard Bracken subsequently led the company through its return to public markets. The buyout introduced a substantial financial burden into a business that already required significant operating and capital investment. Unlike Hilton, HCA couldn’t fundamentally separate itself from the cost of delivering its core service.
There was also a major shareholder distribution before the IPO. HCA’s 2010 Form 10-K records distributions totaling approximately $4.33 billion, financed through available credit facilities, debt issuance and cash. Those payments created liquidity for shareholders but also illustrate the importance of examining the relationship between financing decisions and the capital requirements of the underlying operation.
HCA returned to public markets in March 2011 through an offering of approximately 126.2 million shares at $30 per share. The company sold approximately 87.7 million new shares, generating roughly $2.51 billion in net proceeds, while existing shareholders sold additional stock. HCA intended to use its proceeds primarily to reduce indebtedness and for general corporate purposes.
At the end of 2011, HCA reported $29.68 billion in annual revenue, $6.06 billion in adjusted EBITDA and approximately $27.05 billion in total debt. Its reported debt-to-adjusted-EBITDA ratio was 4.46 times. There was meaningful operating profitability, but leverage remained substantial, as did the capital needed to maintain and develop its facilities.
The economics behind HCA’s growth
HCA’s competitive advantage is built around operating facilities in markets where it has established clinical capabilities, physician relationships, payer contracts, local presence and infrastructure. Those capabilities require time and capital to replicate, making market entry considerably more complicated than launching a new consumer product or e-commerce business.
But healthcare introduces constraints that make conventional marketing growth measures inadequate. HCA can’t simply stimulate demand without considering medical necessity, quality, capacity and clinical outcomes. Nor can the organization maximize contribution margin without accounting for the requirements of patient care, regulatory obligations and access.
A useful economic unit might be a hospital, a service line, an outpatient facility or additional clinical capacity. Growth quality then depends on the demand served, reimbursement rates, service complexity, utilization, labor requirements, capital investment and the clinical and financial outcomes produced.
At the end of 2025, HCA operated 190 hospitals, 121 freestanding ambulatory surgery centers and 31 freestanding endoscopy centers. Its reported revenue reached $75.60 billion, compared with $70.60 billion in 2024 and approximately $65.0 billion in 2023. That represents substantial growth from the $29.68 billion reported in 2011, although the historical increase reflects many years of acquisitions, market development, pricing, reimbursement changes and operating activity.
| HCA metric | 2023 | 2024 | 2025 |
|---|---|---|---|
| Revenue | ~$65.0B | $70.60B | $75.60B |
| Operating cash flow | $9.43B | $10.51B | $12.64B |
| Capital expenditures | $4.74B | $4.88B | $4.94B |
| Operating cash less capex | $4.69B | $5.64B | $7.69B |
| Share repurchases | $3.81B | $6.04B | $10.07B |
The operating cash numbers are particularly important because they show that HCA continued generating substantial cash after funding its reported capital expenditures. In 2025, operating cash exceeded capital expenditure by approximately $7.69 billion, before acquisitions, dividends and other financing uses.
That provides a meaningful degree of operating flexibility. But the company also repurchased approximately $10.07 billion in stock during 2025, while indebtedness increased by approximately $3.29 billion. Total debt reached $46.49 billion, and interest expense was approximately $2.25 billion. A business can be operationally strong while still making aggressive financial decisions that deserve scrutiny.
I’d also examine what’s driving the revenue increase. HCA reported 6.6% same-facility revenue growth in 2025, reflecting the combined effect of a 2.4% increase in equivalent admissions and a 4.1% increase in revenue per equivalent admission. The distinction matters because revenue per admission is influenced by service complexity, payer mix and reimbursement arrangements, not simply the company’s ability to increase prices.
Another important consideration is the role of government reimbursement. HCA reported approximately $6.2 billion in revenue from Medicaid state-directed and supplemental payment programs during 2025, compared with $5.5 billion in 2024. These programs are subject to policy and regulatory changes. A business that depends on them needs to understand how changes in government financing could affect the economics of its facilities and services.
The company’s geographical concentration adds another dimension. HCA’s June 2026 filing reported that hospitals in Texas and Florida accounted for approximately 55% of quarterly revenue and 58% of admissions. Concentration can produce operating advantages through local scale, physician relationships and resource allocation, but it also increases exposure to the regulatory, reimbursement and competitive conditions of those markets.
Why HCA’s model has endured
HCA has sustained a business that generates sufficient operating cash to support substantial ongoing investment, despite its high capital requirements. Its physical presence, established clinical services and market relationships create meaningful barriers to entry, while the operating network provides opportunities for scale in technology, procurement, administrative support and specialized services.
That doesn’t mean each hospital or service line is equally profitable, nor does company-wide operating cash establish that every capital investment produces an attractive return. I’d want to see the economics by market and service line, including patient volumes, payer mix, clinical labor, utilization, cost per case, reimbursement, capital requirements and quality outcomes.
I’d also distinguish between investment that preserves current operating capacity and investment intended to produce incremental growth. Both are necessary, but their economic implications differ. A new surgical facility may create additional capacity and revenue, while replacing aging equipment may be necessary simply to maintain the existing service proposition. Treating both as equivalent growth investment can obscure the actual return on incremental capital.
For a growth executive, HCA demonstrates that sustainable growth isn’t exclusively about reducing capital intensity. A company can operate with substantial fixed assets, labor requirements and debt if its demand, margins, cash generation and reinvestment obligations remain sufficiently aligned. The question is whether management can maintain that alignment as market conditions, reimbursement structures and service requirements change.
HCA also illustrates why financial measures need to be supplemented by operating and service-quality indicators. In healthcare, profitability cannot be evaluated independently of patient safety, clinical outcomes, access and regulatory compliance. Any framework that rewards financial performance while ignoring those obligations would be incomplete.
Party City: When the organization becomes larger than its economic advantage
Party City is perhaps the most revealing of the three businesses because its historical competitive position seemed so substantial. It had a nationally recognized retail brand, hundreds of stores, manufacturing and wholesale capabilities, access to a broad assortment of party-related merchandise and relationships with retailers beyond its own physical network.

In June 2012, Thomas H. Lee Partners announced a transaction involving Party City valued at approximately $2.7 billion. The acquisition was completed in July 2012 through a structure in which Thomas H. Lee-affiliated funds held approximately 70%, Advent International held approximately 24%, and management and other investors held the remainder.
The business included Party City stores, franchise relationships and wholesale manufacturing and distribution operations. Its 2015 IPO prospectus described vertical integration as a competitive advantage because the company could design, manufacture, source, distribute and retail products across several channels. Management argued that this structure gave the company cost advantages, product differentiation and substantial distribution reach.
There was a reasonable commercial argument behind the model, but it also introduced significant complexity. Retail stores required occupancy costs, inventory, staffing, merchandising and local operating resources. Manufacturing and wholesale distribution required production facilities, raw materials, inventory, transportation and customer relationships with other retailers. The entire system depended on demand for products with significant seasonal exposure.
Party City went public in April 2015 at $17 per share, selling 21.875 million shares and raising approximately $371.9 million in gross proceeds. The company intended to use the proceeds primarily to repay debt, including senior payment-in-kind toggle notes. Once again, the public listing provided an opportunity to improve the capital structure, but it didn’t change the fundamental requirements of the operating business.
Scale was becoming less protective
Party City’s competitive environment was not particularly forgiving. Consumers could purchase decorations, costumes, tableware, balloons and related merchandise from mass merchants, dollar stores, e-commerce marketplaces and seasonal specialty retailers. A company like Walmart could offer party supplies as one category among many, while Party City needed the economics of the category to support a much larger portion of its organization.
That distinction matters when pricing and demand come under pressure. A mass merchant may use party merchandise to support broader household shopping and customer frequency. Party City’s specialized network had to generate sufficient contribution from the category itself.
There was also a substantial dependency on balloons and helium. Balloons provided a differentiated service because filling helium balloons created a reason for customers to visit a physical location, something conventional e-commerce couldn’t easily replicate. But helium availability was affected by supply constraints beyond the company’s control, exposing the retailer to a disruption in one of its more important services.
The warning signs were visible before COVID-19. Party City’s revenue declined from approximately $2.43 billion in 2018 to $2.35 billion in 2019, while Party City brand comparable sales fell 3.0%. The company cited helium shortages, weak Halloween performance, store closures and other operating factors. It also sold its Canadian retail stores in 2019 and pursued a store optimization program.
Those actions indicate that management was responding to identifiable issues. But the question is whether the response was sufficient, and whether the company could change its operating economics quickly enough while maintaining its financial commitments.
The pandemic subsequently created an enormous shock to social gatherings, celebrations and retail activity. Party City’s revenue fell to approximately $1.85 billion in 2020, before recovering to $2.17 billion in 2021. The rebound initially provided some encouraging indicators, including a substantial recovery in comparable sales against depressed pandemic comparisons.
But the business was still materially smaller than it had been in 2018, and its financial structure remained demanding.
What the 2022 numbers revealed
The 2022 results provide an unusually clear example of why revenue alone is an inadequate measure of business health.
| Party City metric | 2021 | 2022 | Change |
|---|---|---|---|
| Revenue | $2.171B | $2.170B | Essentially flat |
| Gross profit | $768.1M | $732.8M | −$35.3M |
| Gross margin | 35.4% | 33.8% | −1.6 percentage points |
| SG&A | $671.2M | $707.2M | +$36.1M |
| Adjusted EBITDA | $186.0M | $127.7M | −31.4% |
| Operating cash flow | +$51.9M | −$151.9M | −$203.9M |
| Capital expenditures | $79.2M | $97.5M | +$18.3M |
| Inventory | $443.3M | $633.4M | +42.9% |
| Total debt | $1.437B | $1.703B | +18.5% |
Figures use the comparative presentation in Party City’s Form 10-K for fiscal 2022, filed in March 2024 after its first bankruptcy. The company had reported different historical non-GAAP adjusted EBITDA figures in earlier communications, so comparisons should use consistent filing definitions.
These figures tell a far more concerning story than flat revenue. Gross profit declined by approximately $35 million, while SG&A increased by another $36 million. Together, those changes reduced the spread between gross profit and SG&A by more than $71 million.
Inventory increased approximately 43% while annual revenue was effectively unchanged. The company attributed much of the operating cash deterioration to inventory purchases at higher costs caused by freight and raw material inflation, along with weaker operating income. Cash from operations declined by approximately $204 million year over year, and the company consumed roughly $249 million more cash from operations than it spent on capital expenditure.
That level of deterioration should change the entire growth conversation.
The challenge is no longer simply acquiring more customers or increasing transaction volume. The organization needs to understand whether its pricing, assortment, inventory, supplier economics, store structure and commercial strategy can produce enough contribution and cash to support continued operations.
The forecasts were deteriorating during the year
One of the more useful pieces of evidence is how management’s outlook changed during 2022.
In February 2022, Party City initially projected revenue of approximately $2.275 billion to $2.350 billion, with adjusted EBITDA guidance of $275 million to $300 million. By May, the company’s adjusted EBITDA outlook had declined to $235 million to $265 million. In August, it was lowered again to $170 million to $200 million.
The 2022 annual filing ultimately reported adjusted EBITDA of approximately $127.7 million. Because historical non-GAAP measures were subsequently revised, the absolute figures should not be treated as a perfectly comparable mechanical bridge. Nevertheless, the successive downward revisions to contemporaneous management guidance are clear evidence that expectations were deteriorating during the year.
This is where I’d want to understand how the organization was using its operating data. Were gross margins, inventory commitments, store productivity and customer demand being assessed together? Was the forecast incorporating the financial consequences of changing consumer behavior and rising costs quickly enough? And were decisions being made with sufficient urgency as the outlook deteriorated?
Those questions are easier to ask retrospectively, and public financial statements cannot establish what management knew internally or what alternatives were available. But a structured Growth Quality Score would have focused attention on the relationship between deteriorating demand quality, falling margins, increasing working capital requirements and the company’s limited financial flexibility.
Why the first bankruptcy wasn’t enough
Party City filed for Chapter 11 in January 2023, with approximately $1.7 billion in debt and an operating business facing substantial financial pressure. It emerged from restructuring in October 2023 after eliminating nearly $1 billion of debt, renegotiating lease terms and reducing its store portfolio.
CEO Brad Weston described the company as financially stronger and positioned for future growth. The business emerged with nearly 800 locations and additional financial flexibility. Those were meaningful achievements, particularly given the scale of the debt obligations and the complexity of restructuring a national retail organization.
But the underlying competition, consumer demand and operating requirements didn’t disappear with the debt reduction.
By the period between July 2023 and July 2024, Party City’s comparable-store sales had declined approximately 9.5%, while sales in its consumer products division fell approximately 24.8%, according to reporting on its second bankruptcy. Continued inflationary pressure, weaker discretionary spending and competition from alternative retailers contributed to the deterioration.
In December 2024, the company filed for Chapter 11 again and began winding down its corporate retail and wholesale operations. In February 2025, an affiliate of Ad Populum won an auction for the Party City brand and related Amscan operating assets with a net bid value of approximately $20 million.
That final transaction is particularly interesting. A recognizable brand and certain commercial assets retained value after the business operating around them became unsustainable. The $20 million winning bid cannot be compared directly with the 2012 enterprise valuation because the assets, obligations and transaction circumstances were fundamentally different. But it illustrates why we need to separate the value of an asset or capability from the value of the organization built around it.
What I’d have wanted Growth to diagnose
Party City’s problems extended across the enterprise. No single marketing initiative could have guaranteed a successful turnaround. But the growth function should have been working with Finance, Merchandising, Supply Chain and Operations to understand where customer and unit economics were deteriorating.
I’d have wanted store-level contribution economics, including revenue by category, traffic, conversion, basket size, gross margin, occupancy, staffing, fulfillment and inventory carrying costs. Those measures should have been compared across markets and store cohorts, distinguishing stores creating sustainable contribution from those consuming resources without sufficient returns.
The customer analysis would need to account for frequency, seasonality, occasion-driven purchasing, cross-category behavior and price sensitivity. A Halloween shopper, a customer purchasing balloons for a birthday and a frequent small-business customer may have very different economics, purchase cycles and alternatives.
I’d also have examined whether wholesale distribution and vertical integration were still providing meaningful advantages. Manufacturing product internally can improve margins and differentiation when volumes and utilization support the model, but it can also introduce inventory, capital and fixed costs that become difficult to absorb as demand changes.
The central question would have been whether the organization could redesign the business around the capabilities and customer segments that still produced attractive economics, rather than continuing to support the entire historical operating structure.
Party City’s failure can’t be reduced to private equity, COVID-19, helium or Amazon. Those factors were important, but the deterioration reflected their combined effect on a business with substantial fixed costs, debt and limited financial flexibility.
What the three businesses tell us
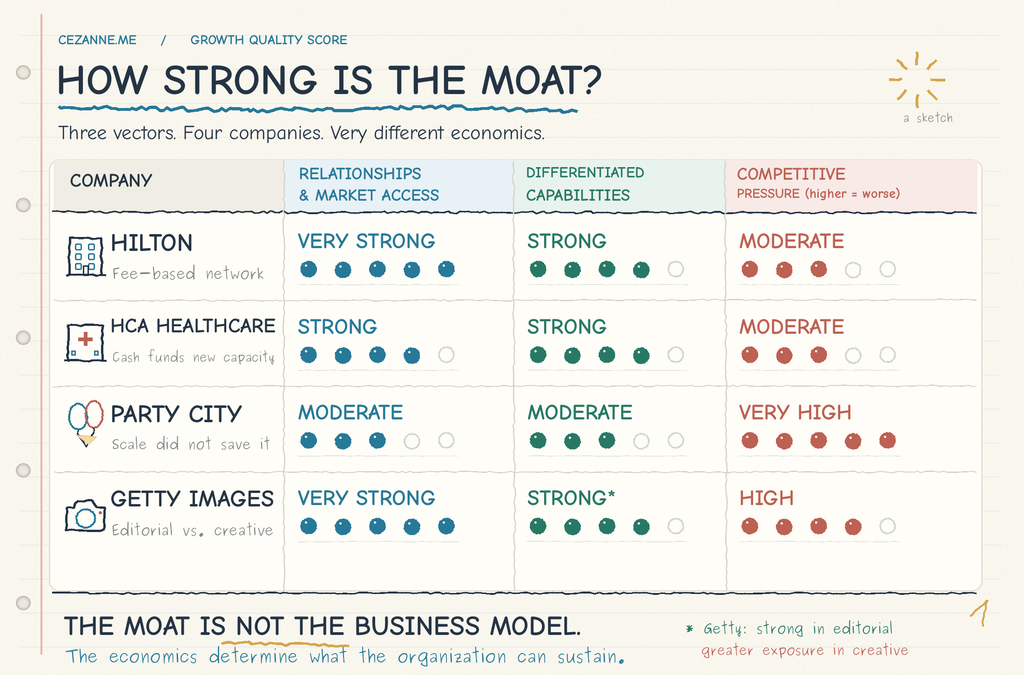
Hilton, HCA and Party City don’t establish that one particular business model is universally superior. Hilton evolved toward a capital-light commercial network, HCA continued operating a capital-intensive healthcare system, and Party City attempted to sustain a vertically integrated retailer under increasingly difficult conditions.
What matters is how each company converted its capabilities and relationships into economic value, and whether the organization could sustain the investment required to maintain those advantages.
Hilton’s brand, distribution and loyalty capabilities supported continued fee-generating expansion without the company needing to own the majority of the properties added to its network. HCA’s established market positions and operating capabilities generated sufficient cash to support substantial ongoing investment, even with significant financial obligations. Party City’s brand, stores and manufacturing capabilities remained recognizable, but the economics associated with operating them deteriorated to the point where financial restructuring alone wasn’t sufficient.
There is an important limitation to this comparison. These companies operated in different industries and periods, and I selected them knowing the outcomes. A retrospective explanation cannot establish that the Growth Quality Score would have correctly predicted their future. A credible model would need to be tested across a much larger population of businesses using information available before the outcomes occurred.
Nevertheless, the histories reveal the kinds of relationships I’d want to examine: demand quality, incremental contribution, working capital, capital requirements, pricing power, financing flexibility and the speed with which an organization can respond when those conditions change.
How I’d use the Growth Quality Score to steer an organization
I wouldn’t start with a new dashboard or a scoring exercise. I’d begin with a more fundamental question: what do we actually know about the economics of the customers, products and services that produce growth, and how confidently can we connect that understanding to the company’s financial performance?
In many organizations, the information exists in different systems, but it’s rarely reconciled into a consistent operating view. Marketing measures acquisition costs and reported conversions. Product examines activation and engagement. Sales measures pipeline, bookings and contract value. Finance reports revenue, margins, working capital and cash flow. Operations measures capacity, productivity and service delivery.
Each function may be reporting accurately within its own definitions while leadership still lacks a reliable understanding of the complete growth system.
Start with the customer, including the one we don’t know yet
For customer-facing businesses, I’d build the analysis around the progression from unknown prospect to identifiable customer, through acquisition, onboarding, monetization, retention, reactivation and eventual attrition.
We need to understand where customers originate, what motivates their initial purchase, which behaviors indicate future value, what it costs to acquire and serve them, and how those economics change over time. The objective isn’t simply better attribution or a more elaborate customer dashboard. It’s establishing an economic view of the customer that the business owns and can use to make decisions.
That requires connecting acquisition data, transactions, customer behavior, product usage, service interactions, refunds, discounts and financial outcomes. Where appropriate, predictive LTV models can help estimate future contribution from early behavior, but those estimates need to be calibrated against realized cohort performance rather than accepted as facts because a model produced them.
I’d also want to distinguish customers acquired through different offers, channels and product experiences. A lower acquisition cost doesn’t automatically mean a better customer. Heavy promotional activity can reduce reported CAC while attracting customers with weaker retention, lower repeat frequency or greater servicing requirements.
The question is whether the next cohort is expected to produce more economic value than it costs to acquire and serve, and whether those expectations are being realized.
Understand the marginal economics, not just the blended average
One of the easiest ways for a business to miss deterioration is to rely too heavily on blended historical performance.
A subscription company might report a favorable LTV ratio because it acquired large customer cohorts several years earlier at attractive costs. Meanwhile, its most recent customers may be more expensive to acquire, slower to monetize and less likely to retain. The blended ratio can look respectable even as the economics of incremental growth are weakening.
Similarly, a retail business may report stable aggregate revenue while new stores deliver weaker contribution, mature stores experience declining productivity and inventory requirements increase. Party City’s 2022 results provide an example of why revenue stability should never be confused with economic stability.
I’d examine marginal contribution, payback, acquisition costs, retention and capital requirements by cohort, product, segment, market and channel. The analysis needs to account for genuinely incremental activity, rather than accepting every platform-reported conversion or sales increase as growth created by marketing.
This is where experimentation becomes essential. Holdouts, geographic tests, incrementality studies and carefully designed product or pricing experiments can help distinguish activity that creates additional economic value from activity that would have happened anyway.
Reconcile the operating view to Finance
The growth function needs a direct relationship with Finance that extends beyond budget approvals and monthly reporting.
I’d establish agreed definitions for contribution, customer value, payback, working capital implications and incremental returns. Those definitions should be reflected in the company’s operating data, forecasting and financial reporting, with differences investigated rather than explained away.
A campaign that improves reported customer acquisition efficiency but increases discounting, refunds or downstream servicing costs may not improve the business. A new distribution arrangement that expands sales while compressing margins could produce attractive top-line growth but weaker overall economics.
The same applies to technology and organizational investment. Reducing the cost of completing a task is useful, but the broader question is whether the change improves contribution margin, customer outcomes, operating capacity or cash generation. Savings that simply shift work and expense to another team don’t necessarily improve the operating model.
I would also distinguish maintenance investment from investment intended to create incremental growth. A business needs both, but mixing them can obscure the returns generated by new activity.
Connect the score to competitive and environmental changes
The Growth Quality Score should never operate independently of the external environment.
I’d maintain a separate view of market conditions, competitor activity, changes in customer expectations, technological alternatives, supplier concentration, channel dependency, regulation and financing conditions. This is where the Doomsday Score becomes useful, particularly for identifying the ways a category’s established competitive advantages may be weakening.
For example, consider what happens if the realized price of a company’s core product falls 20% while costs remain unchanged. It needs 25% more volume simply to recover the original revenue. At a 50% price reduction, it needs twice the volume. If the cost of serving that additional demand doesn’t decline proportionately, revenue recovery alone might not restore contribution or cash flow.
I’d want the organization to model these scenarios before significant price compression occurs. The purpose isn’t to predict every possible disruption, but to understand which economic assumptions are critical and how much room the company has to respond.
The same framework can evaluate opportunities. New technologies may allow a company to automate expensive activities, introduce new products, expand distribution or improve customer intelligence. But we should examine those developments through their effects on the business, not simply their novelty.
Build an operating cadence that changes decisions
I would use the first 90 days to establish the financial and customer baseline, identify the largest sources of economic deterioration or opportunity, and begin testing changes in resource allocation, product economics and the customer journey.
The first 30 days would focus on reconciling performance and understanding the operating model. The following 30 days would examine where the economics differ across cohorts, channels, products, markets and operating units. By the third month, leadership should be making informed changes to investment, accountability and the activities that materially affect growth quality.
That might mean redirecting acquisition investment toward more valuable customers, reducing promotional dependency, changing product packaging, improving retention, reallocating organizational resources or reconsidering parts of the business that no longer produce sufficient economic value.
Beyond the initial assessment, I’d establish a weekly operating review focused on changes in the leading indicators, a monthly reconciliation with Finance covering realized economic performance, and a quarterly assessment of the external environment, capital allocation and organizational requirements.
The distinction between those cadences matters. Weekly discussions should influence near-term decisions. Monthly reviews should establish whether the decisions are improving financial outcomes. Quarterly reviews should challenge whether the strategy, resource allocation and operating model remain appropriate for the conditions ahead.
I’d also want a record of material operating decisions, including the original assumptions, intended outcomes, expected economic effects and actual results. Businesses learn much less than they should from decisions because the assumptions behind them are rarely preserved in a way that can be evaluated later.
A disciplined operating review should examine both successful and unsuccessful decisions. If a pricing experiment increases conversion but reduces customer contribution, we should understand why. If a new acquisition channel generates attractive early results but weaker retention, that information should influence the next allocation decision. If the organization repeatedly identifies a problem but cannot act because ownership is unclear, that’s an operating-model issue, not a measurement problem.
What would make the score useful rather than decorative?
I’d want to see evidence that the Growth Quality Score changes capital allocation, product decisions, customer strategy and organizational priorities.
The initial score should establish a baseline, but its movement over time is more important than the absolute number. I’d also separate the underlying economic components from the confidence of the data supporting them. A company whose customer economics are poorly understood should not receive the same assessment as one with reconciled, consistently measured outcomes.
I’d avoid presenting the score as a probability of bankruptcy or success. That would require much more extensive historical testing and sector-specific calibration. Its initial value is diagnostic: identifying the relationships between growth, margins, cash, competition and organizational capability that conventional reporting may overlook.
The model should also allow leadership to distinguish external pressure from internal execution. A decline in market demand isn’t the same as losing share because of a deteriorating customer proposition. Both can affect revenue, but they require different decisions.
And there needs to be accountability for change. If customer economics are weakening, Growth, Product, Operations and Finance should be working from the same evidence and making coordinated decisions. A score that identifies problems without connecting them to owners, actions and outcomes simply adds another layer of reporting.
Bringing the analysis back to Getty Images
Getty remains an interesting contemporary test of this thinking because the company still has valuable relationships and capabilities. Its archives, exclusive content arrangements, editorial access, licensing knowledge and enterprise distribution aren’t suddenly worthless because generative AI can produce convincing stock images.
But the economics of its creative and editorial businesses are changing differently. Getty’s second-quarter 2026 results showed editorial revenue increasing 9.2% year over year, while creative revenue declined 2.6%. That contrast suggests that content tied to actual events, specialized access and established rights may face different competitive pressures from more substitutable creative imagery.
A Growth Quality Score assessment would need to examine those businesses separately, including pricing trends, customer retention, contribution, content acquisition costs, licensing economics and the cost of maintaining the capabilities required to serve each market.
I’d also want to understand whether the company’s financial restructuring provides enough flexibility to change its business mix and operating structure, and whether management can develop additional revenue streams around the capabilities that remain differentiated.
The question isn’t simply whether Getty survives Chapter 11. Its agreement is designed to preserve operations and strengthen its financial position. The more consequential question is whether the resulting business can produce sustainable growth under an operating model designed for the market ahead, rather than the economics that made it successful in the past.
The larger question
Looking back at the Yale Club conversation, I understand why being described as the “how” guy stayed with me. The longer I’ve worked across businesses, the more I’ve come to appreciate how much value sits in understanding how something actually operates, where the economics originate and what needs to change when the environment becomes less favorable.
Ideas matter, and innovation matters. But executing an idea, developing the customer relationships that support it, building the right capabilities and maintaining the economic discipline required to sustain the business is a considerably more complicated undertaking.
Hilton, HCA and Party City show that successful businesses don’t all look alike. A capital-light franchise network and a capital-intensive healthcare operator can both create substantial economic value, provided their operating models support the requirements of their industries. A recognized brand and extensive distribution network, meanwhile, can become increasingly difficult to sustain when demand, pricing, costs and financial obligations stop working together.
The challenge for founders, CEOs and growth executives is recognizing when those conditions are changing, and making the necessary decisions while the organization still has the financial and operational flexibility to respond.
I suspect nearly every category has its own version of a Doomsday Score. The exposure may vary, and disruption won’t necessarily produce failure, but the moats we once thought were extraordinarily difficult to challenge may become increasingly vulnerable as technology, customer behavior and competition change.
The Growth Quality Score is my attempt to develop a more systematic way of understanding what those changes mean for an individual business, how its economics are evolving and whether its operating model can support the next phase of growth.
I want to know whether we’re building a business that becomes economically stronger as it scales, or simply expanding the size and complexity of an organization whose historical advantages are becoming less valuable. The earlier we can answer that question, the greater our ability to do something useful with the answer.
And that’s ultimately what being the “how” guy has always meant to me.
Research sources and financial notes
Getty Images
- Getty Images, October 12, 2026 restructuring announcement. The planned prepackaged Chapter 11, financing commitments and anticipated operating continuity.
- Getty Images, October 12, 2026 SEC Form 8-K. Restructuring terms, debt arrangements and shareholder ownership provisions.
Hilton Worldwide
- Blackstone, October 24, 2007 acquisition completion. Acquisition terms and shareholder consideration.
- Hilton Worldwide, 2013 IPO prospectus. Management and franchise expansion, ownership structure, room growth and international development.
- Hilton, January 2017 separation announcement. Separation of Park Hotels & Resorts and Hilton Grand Vacations.
- Hilton Worldwide, 2025 Form 10-K. Hotel network, customer relationships, segment economics, cash generation and debt.
- Hilton, full-year 2025 results. Adjusted EBITDA, network expansion and RevPAR.
HCA Healthcare
- HCA, November 2006 private acquisition announcement. Transaction value, sponsors and management.
- HCA, March 2011 IPO announcement. Offering structure and financing.
- HCA Holdings, 2011 Form 10-K. Revenue, adjusted EBITDA, financing and debt.
- HCA Healthcare, 2025 Form 10-K. Operating performance, cash flows, capital expenditure, reimbursement, debt and repurchases.
- HCA Healthcare, second-quarter 2026 Form 10-Q. Market concentration and reimbursement exposure.
Party City
- Party City, 2015 IPO prospectus. Ownership, business model, competitive position and IPO terms.
- Party City, 2019 financial information. Comparable sales, helium shortages, store optimization and pre-pandemic performance.
- Party City, fiscal 2022 Form 10-K, filed March 2024. Revenue, margins, operating cash, inventory, EBITDA and debt.
- Party City, February 2022 results and guidance. Initial 2022 revenue and profitability expectations.
- Party City, August 2022 guidance revision. Reduced revenue and adjusted EBITDA expectations.
- Party City, October 2023 restructuring completion. Debt reduction and restructuring outcomes.
- Retail Dive, December 2024 liquidation reporting. Post-restructuring trading deterioration and competitive pressures.
- Party City, February 2025 intellectual-property auction announcement. Sale of brand and associated assets.
Methodology: The Growth Quality Score and Doomsday Score are proposed analytical frameworks. Financial data are from historical company filings and disclosures, with calculated margins and changes derived from reported amounts. Adjusted EBITDA is a non-GAAP measure and is not directly comparable across companies or necessarily across restated reporting periods. The framework has not yet been calibrated or backtested as a predictive measure of business distress, and these retrospective case studies should not be interpreted as proof of predictive accuracy.
This piece is for members
Members read every essay and framework in full, the moment it is published.





 The newsletter